
Strong Economy Confronts Rising Costs
U.S. economic performance has been better of late than it has been for at least 13 years. While there has been abundant negativity regarding the propriety of tariffs, trade skirmishes, abandonment of various treaties, shifting immigration policy, and rapidly expanding national debt, there can be little debate regarding whether near-term performance has been solid. It has been.
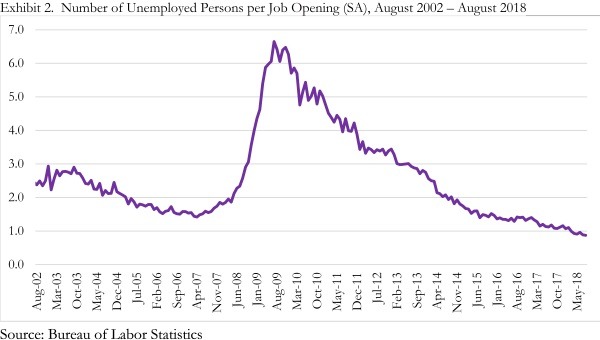
During 2018’s third quarter, the U.S. economy expanded 3.5 percent on an annualized basis. Industrial production has been surging as has capacity utilization. Both white-collar and blue-collar segments have been adding jobs rapidly. As of August, there were 7.14 million available, unfilled jobs in America, an all-time high. According to the most recently available data, there are fewer than 6.1 million unemployed people in America, which means that there are approximately 7 job openings for every 6 jobseekers.
At least theoretically, there is a job for everyone, though job growth has been far more rapid in the American west and south than elsewhere. Among the 25 largest metropolitan areas, the fastest year-over-year job growth (September 2017-September 2018) was recorded in Orlando (5.9%). Other communities registering profound rates of employment expansion include Houston (4.3%), Miami (4.2%), Phoenix (3.8%), Tampa (3.8%), Seattle (3.7%), Dallas (3.0%), Riverside, CA (2.9%), Denver (2.7%), and Charlotte (2.4%). The slowest growing major metropolitan areas are Detroit (0.7%), Chicago (0.7%), and St. Louis (0.8%). But the point is that employment growth is apparent in virtually all significant communities.
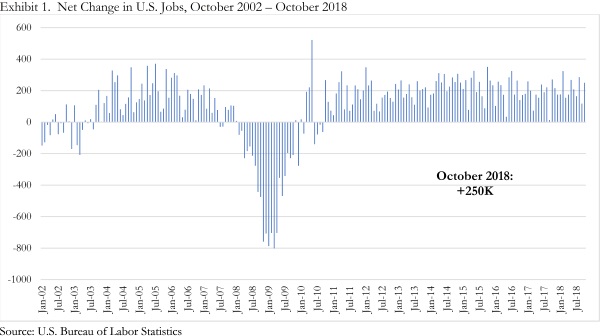
In October 2018, the nation added another 250,000 net new jobs, surpassing the consensus expectation of 190,000 collectively predicted by market analysts. The official rate of unemployment remained at 3.7 percent for the month, effectively the lowest rate since December 1969 when the U.S. was just entering a recession that would last for 11 months.
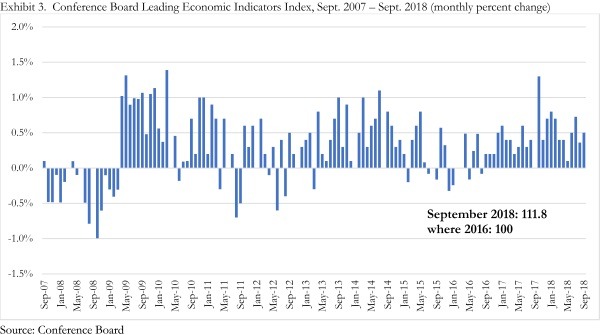
The Conference Board’s Index of Leading Indicators continues to march higher, an indication that economic momentum will persist over the at least the next two to three quarters. Historically, when the values of variables embodied within the index shift unfavorably, the economy is set to experience a downturn. This is precisely the signal the LEI sent in August 2007, when it turned negative four months prior to the Great Recession’s onset. While there have been instances in which the LEI predicted a recession that did not transpire, generally it has been a fairly accurate predictor over the past 50 years. The LEI was indexed to 100 in 2016. The LEI stood at 111.8 this past September, meaning that the latest reading is 11.8 percent higher than it was in 2016. Exhibit 3 supplies recent LEI readings, indicating that the value of the index has continued to grind higher in recent months.
Apart from leading indicators, there are common sense reasons to believe that the U.S. economic expansion will continue for several additional quarters. At the top of the list is the fact that tax reform is still less than a year old. In other words, the impacts of tax cuts are just now being felt in the economy.
The Tax Cuts and Jobs Act, passed in December 2017, restructured income brackets, reduced personal income taxes for many Americans, shrank the C-corporation tax rate to 21 percent and made it easier to repatriate profits earned abroad. While much of the coverage focused on changes to corporate filers or impacts on state and local tax deductions, most stories overlooked some of the less flashy changes in the tax code.
For example, the new law increased the amount a company can immediately expense for certain types of purchases. As stated by the Internal Revenue Services, “a taxpayer may elect to expense the cost of any section 179 property and deduct it in the year the property is placed in service.” The new law increased the maximum deduction from $500,000 to $1 million. It also expanded the definition of section 179 property. Qualified improvements, such as the renovation and improvement of a building’s exterior, would be grouped under a Section 179 property. There are certain restrictions, however, such as the improvements cannot expand the size of the building, nor can they be applied to the addition of an elevator or escalator.
These are precisely the types of tax reforms that mason contractors would want to see. During the economic downturn, investment in many older structures waned as property values dipped and access to capital shrunk. Deferred maintenance became a source of financial liquidity for many building owners.
That was then, this is now. Today, many investors are flush with cash and seeking to aggressively reposition their buildings to compete for high-quality tenants. One of the best ways to reposition a building is to improve the exterior, which often involves brick and other contractors.
Shifting demographics also play a role. Between 2006 and 2017, the population of home-owning households barely budged in America. Meanwhile, the population of renter households surged 26 percent due to a combination of the foreclosure crisis, tighter mortgage lending standards, the emergence of Millennials into both the labor and housing markets, and shifting tastes and preferences.
As many know, the growth in renter households has accompanied the rapid expansion of America’s apartment stock, with much of the new product focused on the high end of the market. This high-end product often emphasizes brick and other materials with which masons work. However, there are also many smaller investors who own and rent out townhomes, including large numbers on the east and west coasts. Many of these investors have seen fit to repoint brick and engage in other exterior building improvements to better compete with newly-constructed, professionally-managed buildings. The new tax law renders it more likely that property owners will move forward with new construction and/or renovation projects.
The tax changes also provide more flexibility and resources for contractors when it comes to purchasing new equipment. As a prominent example, contractors who purchase midsize and full-size pickup trucks for their businesses would be able to write off the entire purchase as a result of the changes in the tax code. While it still might be too early to see the impact of the tax law in any data released by official government agencies, other sources could provide some insight. For example, Ford releases monthly reports that provide the number of sales for their various lines of vehicles. As of this writing, year-to-date sales of their F-series of trucks, ones commonly used in the construction industry, were higher in 2018 compared to 2017 over the same time period. This is probably a result of a combination of factors, such as the general overall strength of the economy coupled with advantageous changes built into the new tax code.
Construction Adds Jobs, Too
Data released by the U.S. Bureau of Labor Statistics indicate that the U.S. construction sector added 30,000 net new jobs in October 2018. The industry has added 330,000 net new construction jobs over the past 12 months, representing 4.7 percent growth in employment totals. That represents an absolutely astonishing tally given how difficult it has become to fill available construction job openings. Contractors routinely complain that it has become nearly impossible to find carpenters, electricians, estimators, superintendents among others.
Accordingly, construction industry unemployment has continued to ratchet lower. In October 2009, industry unemployment stood at 18.7 percent. It would rise further during ensuing months, eventually peaking in March 2010 at 24.9 percent. As of October 2018, industry unemployment stood at just 3.6 percent, down from 4.5 percent one year earlier and 5.2 percent one year prior to that.
A variety of leading indicators suggest that contractors can expect to remain busy in 2019. Among the most visible measures are Associated Builders and Contractor’s Construction Backlog Indicator or CBI. During the second quarter of 2018, CBI expanded to its highest level in history, with the average nonresidential contractor indicating 9.9 months of backlog. Backlog, which represents work under contract but not yet completed, expanded 14 percent between the second quarters of 2017 and 2018.
The Architecture Billings Index (ABI), produced by the American Institute of Architects, points in the same direction. Any reading above 50 indicates that architects are collectively busier now than they were the previous month. Index readings have consistently been above 50 in recent months, with the August 2018 reading standing at 54.2. This strongly suggests that commercial construction will remain at healthy levels in 2019, though regional ABI scores reflect a divergence in business conditions between regions. In the South, the ABI score for firms was 57.0, suggesting ongoing increases in design work that will eventually translate into more work for southern contractors, including those in expanding markets like Atlanta and Tampa. But ABI scores in the Northeast have been weaker, perhaps because of growing concerns regarding overbuilding in markets such as New York, Boston, and Washington, D.C.
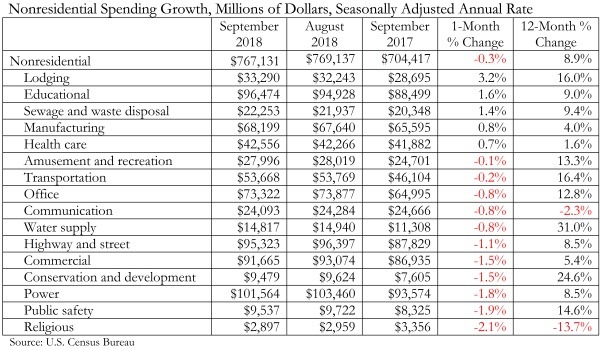
One of the largely ignored aspects of improved U.S. economic performance has been substantial growth in infrastructure outlays. The most recent nonresidential construction spending numbers released by the U.S. Census Bureau confirm sizeable increases on spending related to water supply, flood control, and transit options over the past year. Many stakeholders have been anxiously awaiting a federal infrastructure program, but as of this writing, there appears to be little momentum behind a large-scale federal infrastructure push.
Despite the lack of federal action along this dimension, spending on public works has been surging. This has much to do with improved state and local government finances. According to the Pew Research Center, 34 states are taking in more tax revenue than they were prior to the Great Recession, even after accounting for inflation. West Virginia, for example, closed the last fiscal year with a $36 million budget surplus, the first time in eight years (not counting surpluses created via budget cuts). Maryland, a state that has been associated with only moderate job growth for much of 2018, ended the fiscal year with a surplus of over $500 million. Similarly, North Carolina ran a $440 million surplus. These surpluses have caused some states to reinvest in their own roads and highways. For example, last year, North Carolina awarded $7 million in matching grants to help fund 14 short line railroad/railway projects, and the Maryland Transit Administration has already committed to spending $900 million over the next several years on its public transportation.
Rising property values, ongoing rapid job creation and a confident consumer translate into rising real estate values, income and retail sales tax collections, which in turn creates additional resources to invest in infrastructure. That helps explain the chunky year-over-year spending increases in a number of primarily publicly financed categories nationally. These include water supply, (+31% in September Y-o-Y), conservation and development (+25%), transportation (+16%), and highway/street, (+9%).
Masonry’s Labor Shortage Solution
Human capital shortfalls are felt throughout the economy. This is hardly unique to construction. The recent announcement by Amazon that it would increase its minimum wage to $15/hour is a reflection of the strength of the labor market and the growing pressure on employers to expand wages for purposes of both recruitment and retention.
That said, one could easily argue that the worker shortfall in construction is as bad or worse than in any other major U.S. industry due to a combination of demographic and cultural factors. For a variety of reasons, construction workers tend to be older. This is a reflection of the significant entry into the industry by workers during the economic booms of the 1980s and 1990s, but also the general paucity among younger workers in recent years.
Younger workers tend to emphasize concepts such as flexible time and work-life balance. These demands are often not compatible with construction, which frequently requires people to work in teams, thereby reducing the scope for flexible time. Construction workers also tend to rise earlier than others, which can create challenges for family members required to transport children to school or fulfill other family functions. Some construction projects require construction workers to work overnight, which can also be incompatible with the work-life balance goals of many younger workers.
Then there is the not so small matter of education. For years, young people have been counseled that the only bright future imaginable involves attending college, and probably one that offers a four-year degree. The high stakes testing regimes that have infiltrated many school settings have also resulted in a loss of shop class, apprenticeship opportunities, field trips, and other activities that could potentially expose young people to opportunities in the construction trades. In other words, as you read this, someone may be struggling through a French philosophy class at a university somewhere in America who otherwise could be the world’s greatest mason.
One potential solution to the lack of available human capital is human-replacing technology. It would appear that this represents an important element of mason’s future in America.
In March 2017, Digital Trends, a technology news website, published an article about SAM100 (semi-automated mason), a bricklaying robot. Working alongside a human bricklayer, the robot was six times faster than its human counterpart, capable of laying down 3,000 bricks in one day. Additionally, newly available software upgrades would position the robot to learn different methods regarding future work almost instantaneously. This represents the fusion of robotics and artificial intelligence, a powerful combination that at least theoretically could replace both the physical and intellectual contributions of humans.
While the construction industry has generally been rather slow to adopt new technologies relative to other industries (e.g. financial services, manufacturing, retail), innovations such as SAM100 may ultimately help foment a revolution in the manner in which construction services are delivered.
For now, it is still about humans. Digital Trends reports that one SAM costs around $500,000. Still, the price of technology tends to decline over time, and eventually, more firms will see fit to move to at least a partial robotics model. As indicated by a construction manager, “We don’t see construction sites being fully automated for decades, if not centuries. This is about collaboration between human workers and machines. What SAM does is pick up the bricks, put mortar on them, and puts it on the wall. It still requires a mason to work alongside it. SAM’s just there to do the heavy lifting.”
Looking Ahead
Mason contractors can look forward to a busy 2019. Many contractors report lengthy backlogs. Recent months have been associated with rapid growth in both private and public construction spending. One exception may be the single-family homebuilding market. There, a combination of rising input costs and higher mortgage rates has led to softer activity. But the spate of job growth experienced in many communities recently should keep apartment leasing and construction humming in much of the country next year.
The bigger issue will be the containment of construction delivery costs. Workers and materials have become more expensive over the past year. Arguably, the most difficult job in construction these days is that of the estimator, who much hazard guesses regarding the future of worker compensation, materials costs, and material availability. In other words, the key to 2019 will be to build enough profit margin and contingency into each and every project.
While economic performance should be strong during the initial months of 2019, there are risks thereafter. Recent volatility in financial markets has been triggered in large measure by rising interest rates, which in turn have been the result of tighter Federal Reserve monetary policy. With inflationary pressures continuing to build (e.g. wages, tuitions, steel prices, other inputs), the Federal Reserve will continue to take short-term rates higher, which will likely translate into higher borrowing costs, a more challenging corporate earnings environment, and ongoing financial market volatility.
The next economic downturn could easily be the result of a major decline in asset prices. For many years, asset prices, whether in the form of stock or commercial real estate valuations, have marched higher. This has produced large-scale and positive wealth effects, promoting both more consumer spending and construction activity. However, a meaningful and sustained dip in asset prices would yield precisely the opposite dynamics. Falling asset prices had much to do with the onset of recessions in 1990, 2001, and 2007. Many economists accordingly believe that the next economic downturn could arrive in 2020, give or take.